Few months after initial release a new public version of PSWinReporting 1.0 is released. While the name might not be familiar it's a actually a new name for Get-EventsLibrary.ps1. I've reworked the code multiple times, changed things around and optimized code. Since I wasn't really happy with the name and I do have larger monitoring plans for this module I've decided to rebrand it into PSWinReporting. If you don't know the module by now take a look what it's able to give you below.
💡 What the module can show me?
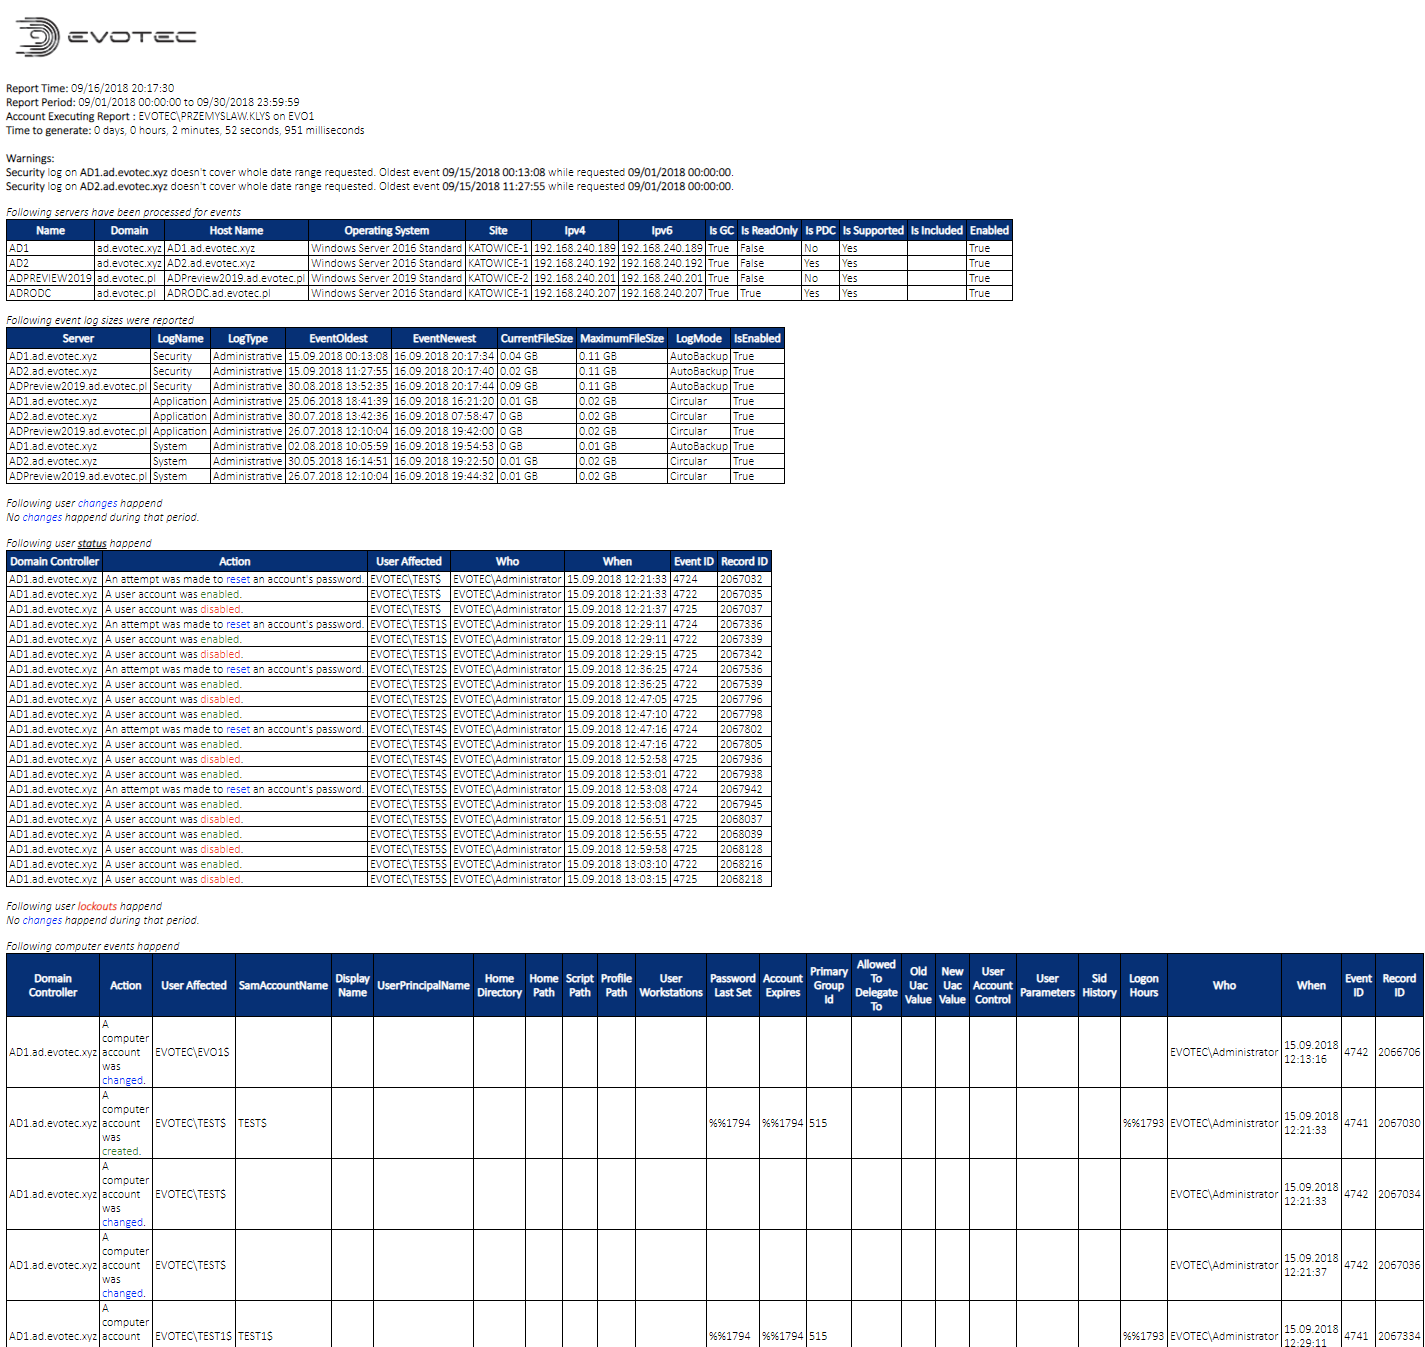
In short… it can show you at least that information
- Group create, delete, modify (Who / When / What)
- Group membership changes (Who / When / What)
- User changes (Who / When / What)
- User create, delete (Who / When)
- User password changes (Who / When)
- User lockouts (Who / When / Where)
But there are more things hidden, as well as more coming…
Please notice this article contains parts of information (still useful) and may not reflect all functionalities of this module. For download, source code and so on you should refer to the dedicated PSWinReporting module page. After reading this one… of course! It contains useful information, examples and know-how.
💡 But what is it actually?
You start it up…
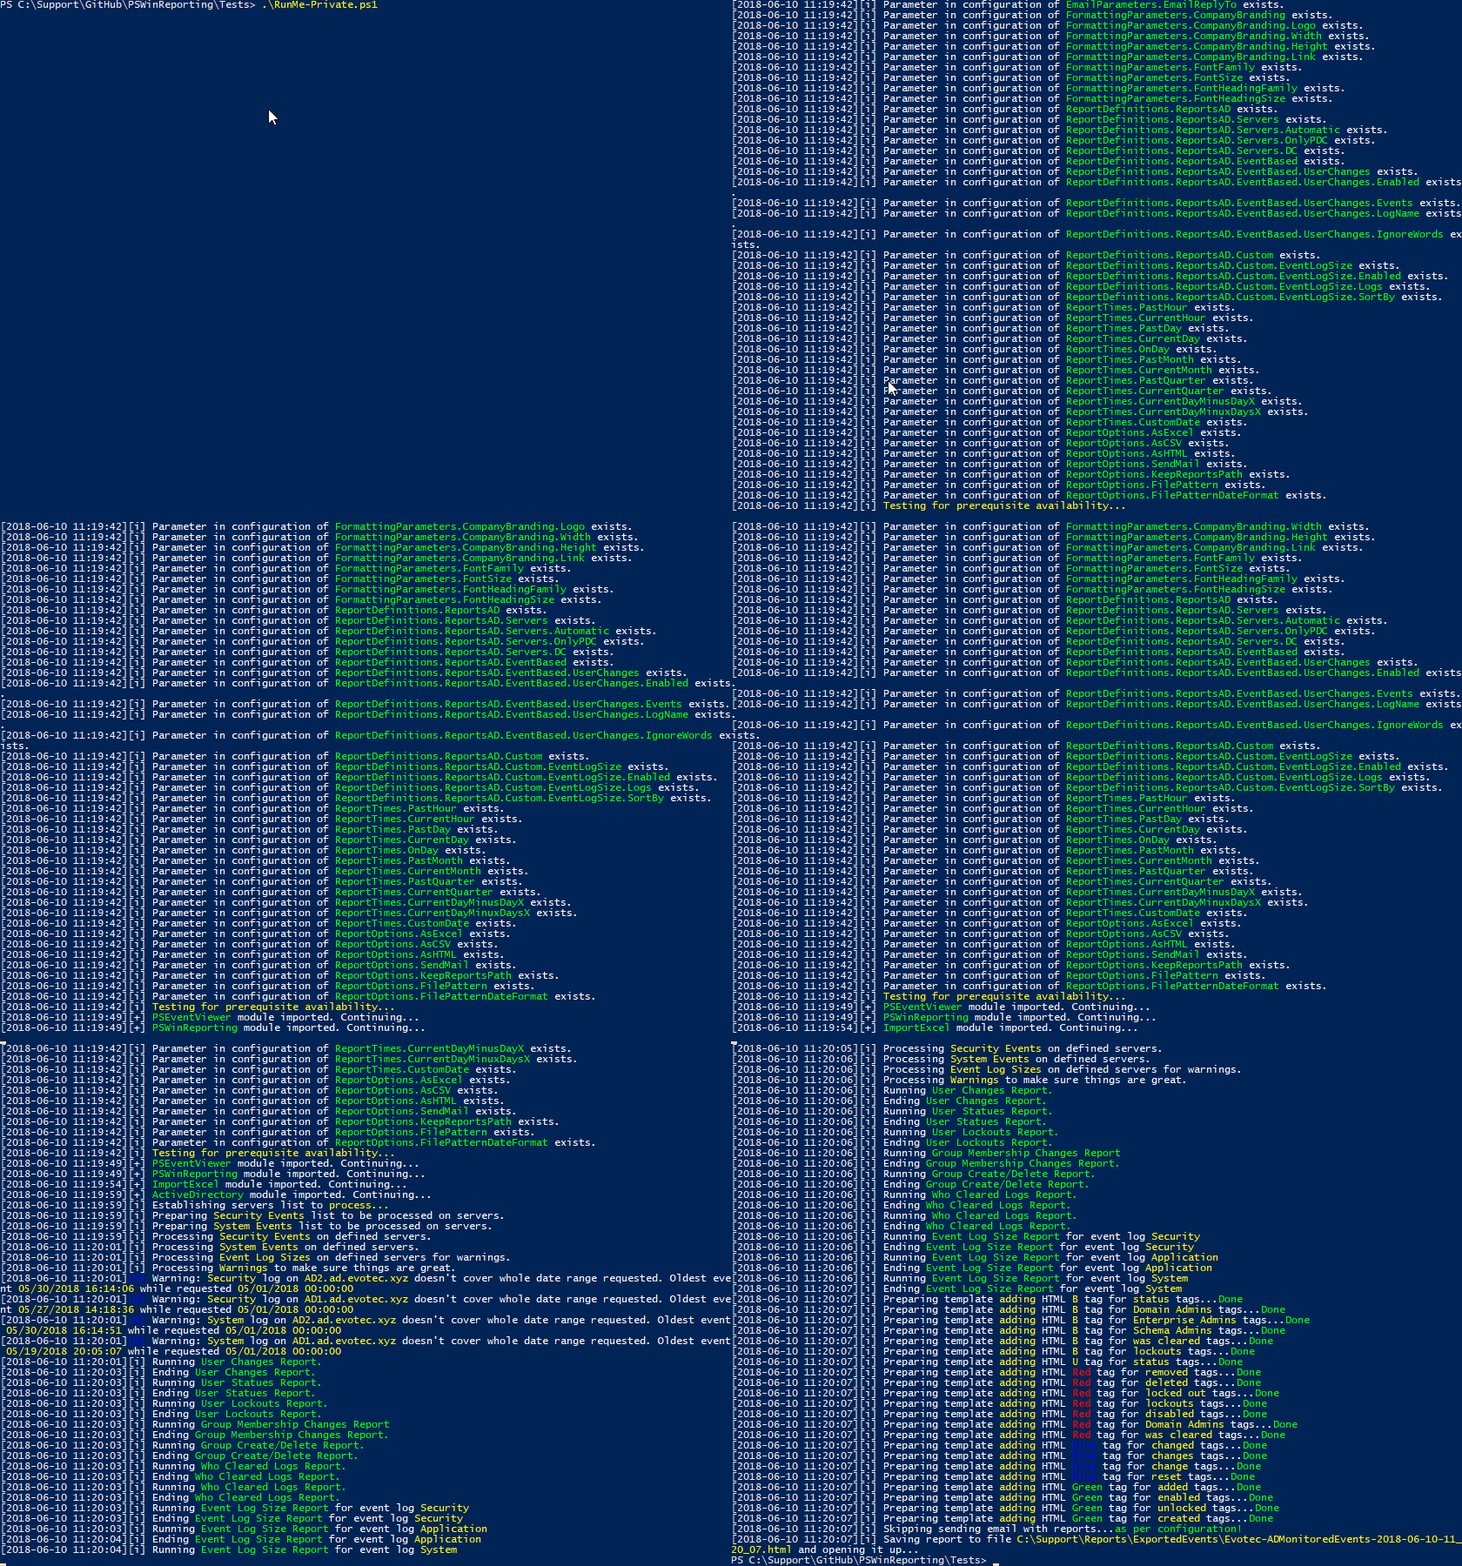
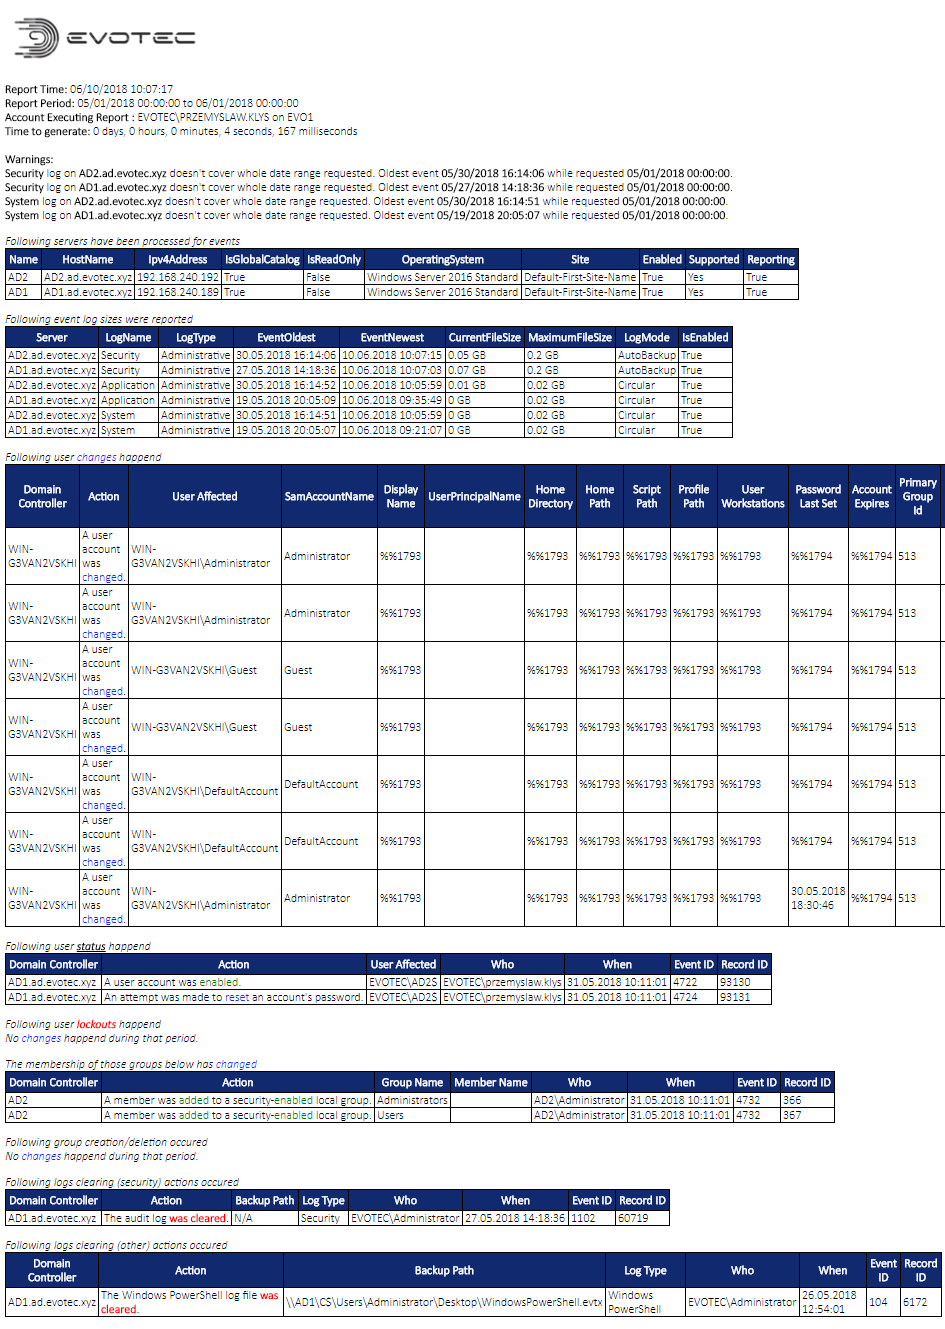
And after it's done… you get these nice report in HTML (actually you can get Microsoft Excel (xlsx) or/and CSV export as well)
💡 Changes from earlier version
So what has changed? I'll tell you. A lot actually.
- It's much, much faster then before
Before the new way for 6 domain controllers spread over geographically with Security log sizes of around 10GB to 30GB depending on DC it was taking 15-18 hours to generate one report. For other Client with just 2 DC's and each having 20GB log sizes it was taking 50 minutes to generate. While for the first Client it wasn't entirely my module fault (Azure HDD speed was heavily affected by Microsoft monitoring) it was way too long. New version is able to deliver the report for the first Client in less then 1 hour. And the 2nd Client with one more DC scanning gets it done in less then 20 minutes. I would say quite a boost…
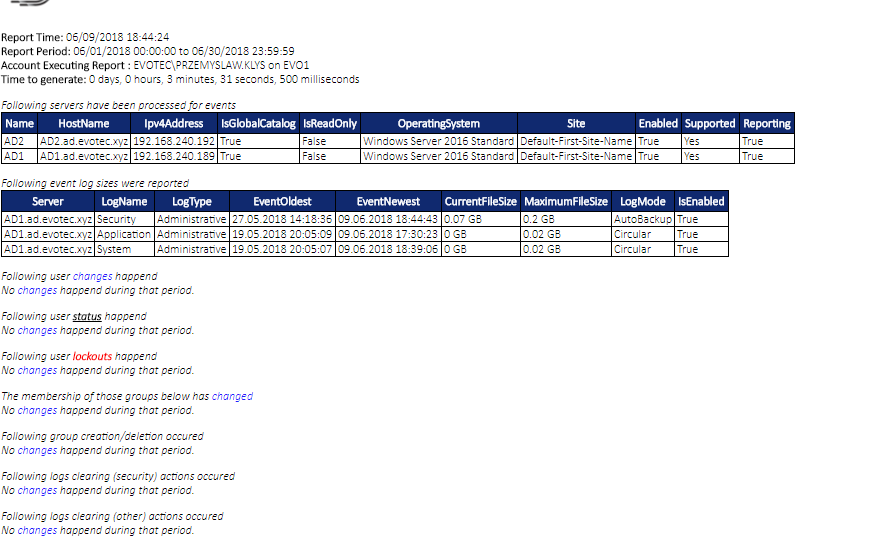
- Adds warnings to report if the requested date range is more than what logs contain
Warnings were added because one of the opinions pointed out that you can actually cause the log to overwrite older entries (that is if you have small log size) therefore hiding what you did. Well this feature actually checks if the logs contain enough data to cover date range requested.
- Adds clear logs (security and others) monitoring
This feature gives you overview who cleaned the logs and when. While it doesn't bring back the logs back.. it does bring you an option to speak to whoever did it and ask why?
- Added event log size monitoring
Monitoring size of event logs, and other data is important thing to do. So here you go…
- Added time to generate report
This feature was added because the earlier versions took really long time to generate. Some custom sites took 15 hours to generate, some 3 hours and I needed to know what is causing this delays and how changes I make impact the time to generate. It's still useful…
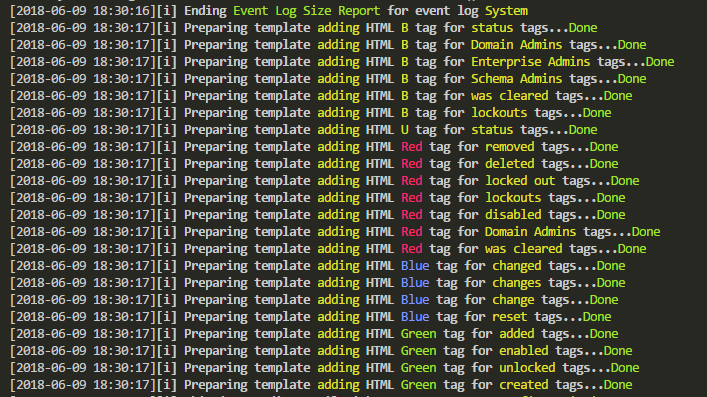
- Completely new way of colorizing texts for reports
In earlier versions the coloring, bolding and underling was predefined. In new version you define the words and what styling those words are supposed to have. That way you can make the report yours. If you want to easily see Domain Admins in red, bold, and italic, you can easily do so.
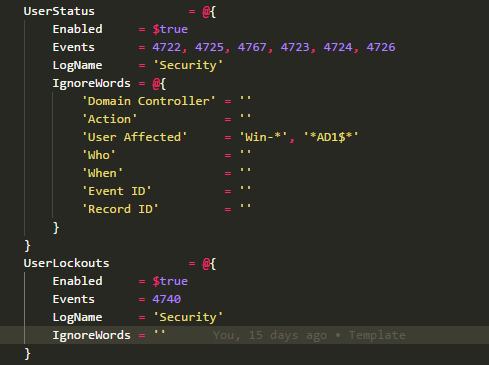
- Ignoring certain words, phrases from showing up in reports
That feature is a must if you've lots of things flying around in your AD.
For each Report you can define IgnoreWords. You have to pick for which Column Name of the report filtering should be applied to. So if you've some service account that's constantly enabling/disabling accounts you can ignore them (as long as it's approved). It's per report so if that account does deletion of groups you still get to see it in another report. Ignore filter uses wildcard comparison. In config above you can see the IgnoreWords are prepared for the UserStatus report. They are not prepared for UserLockouts. You would need to run report at least once, get column names and fill in your information.
And those are just things that are visible. There has been a lot of changes behind the scenes, couple of new settings and overall code is prepared to be a bit more flexible when adding new features.
💡 You convinced me.. where do I get new version?
I've created a dedicated module page. It has the starting script (actually a config) and links to GitHub (for sources just in case you need it)
Please notice this article contains parts of information (still useful) and may not reflect all functionalities of this module. For download, source code and so on you should refer to the dedicated PSWinReporting module page. After reading this one… of course! It contains useful information, examples and know-how.

